Sacramento Grocery Prices in 2026: The Running Report
This is our running record of what groceries cost in Sacramento through 2026. We refresh it at the start of every month, so the charts below always cover everything we have collected so far this year — 7 months, from Feb through Aug.
The grocery basket index
The single number we watch. Each month we compare only the products we priced in both that month and the one before, take the typical change across them, and chain those together into a running level with Feb set at 100. Right now it sits at 100.1 — groceries are up 0.1% since Feb.
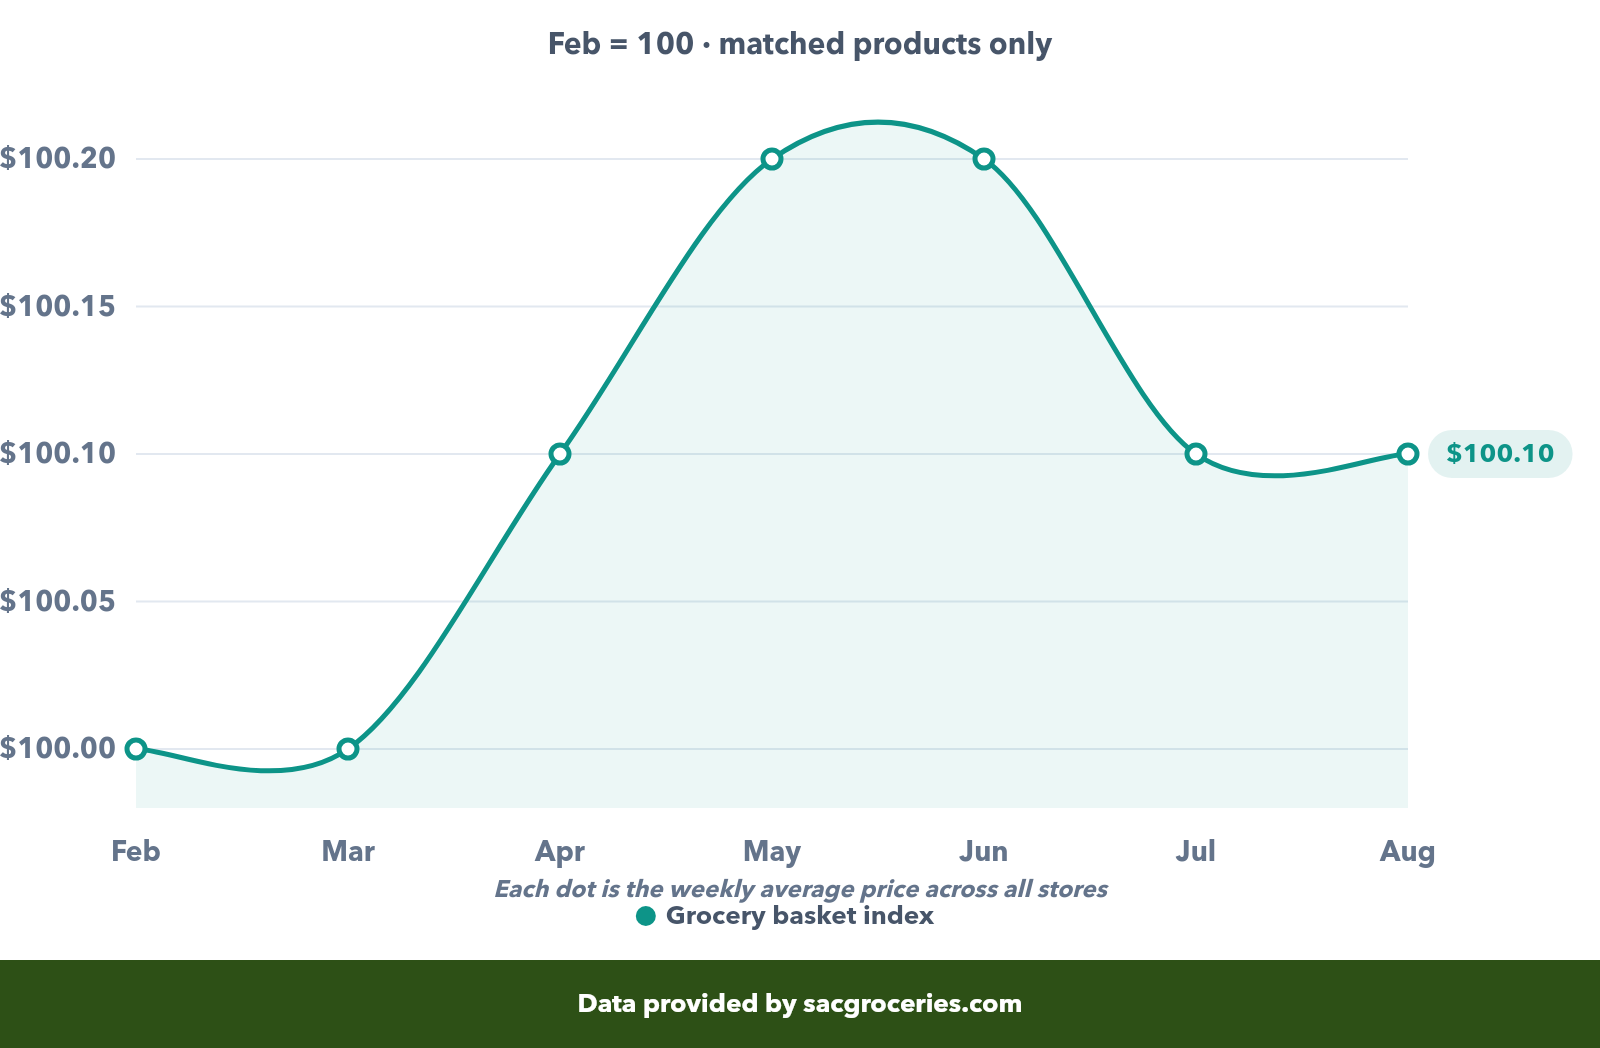
Two honest caveats. It weights every department equally, so it is not a household spending basket — it does not count milk more heavily than mustard. And it tracks our catalog, not the city, so it is a directional read rather than a substitute for the CPI. What it does avoid is the trap of averaging whatever happened to be in stock: comparing the same products month over month keeps a change in what we collected from masquerading as a change in what things cost.
Category trends month by month
Each department indexed to 100 at Feb, so they share one scale and can be read against each other directly. A line at 102 means that department costs 2% more than it did in Feb, on the same products.
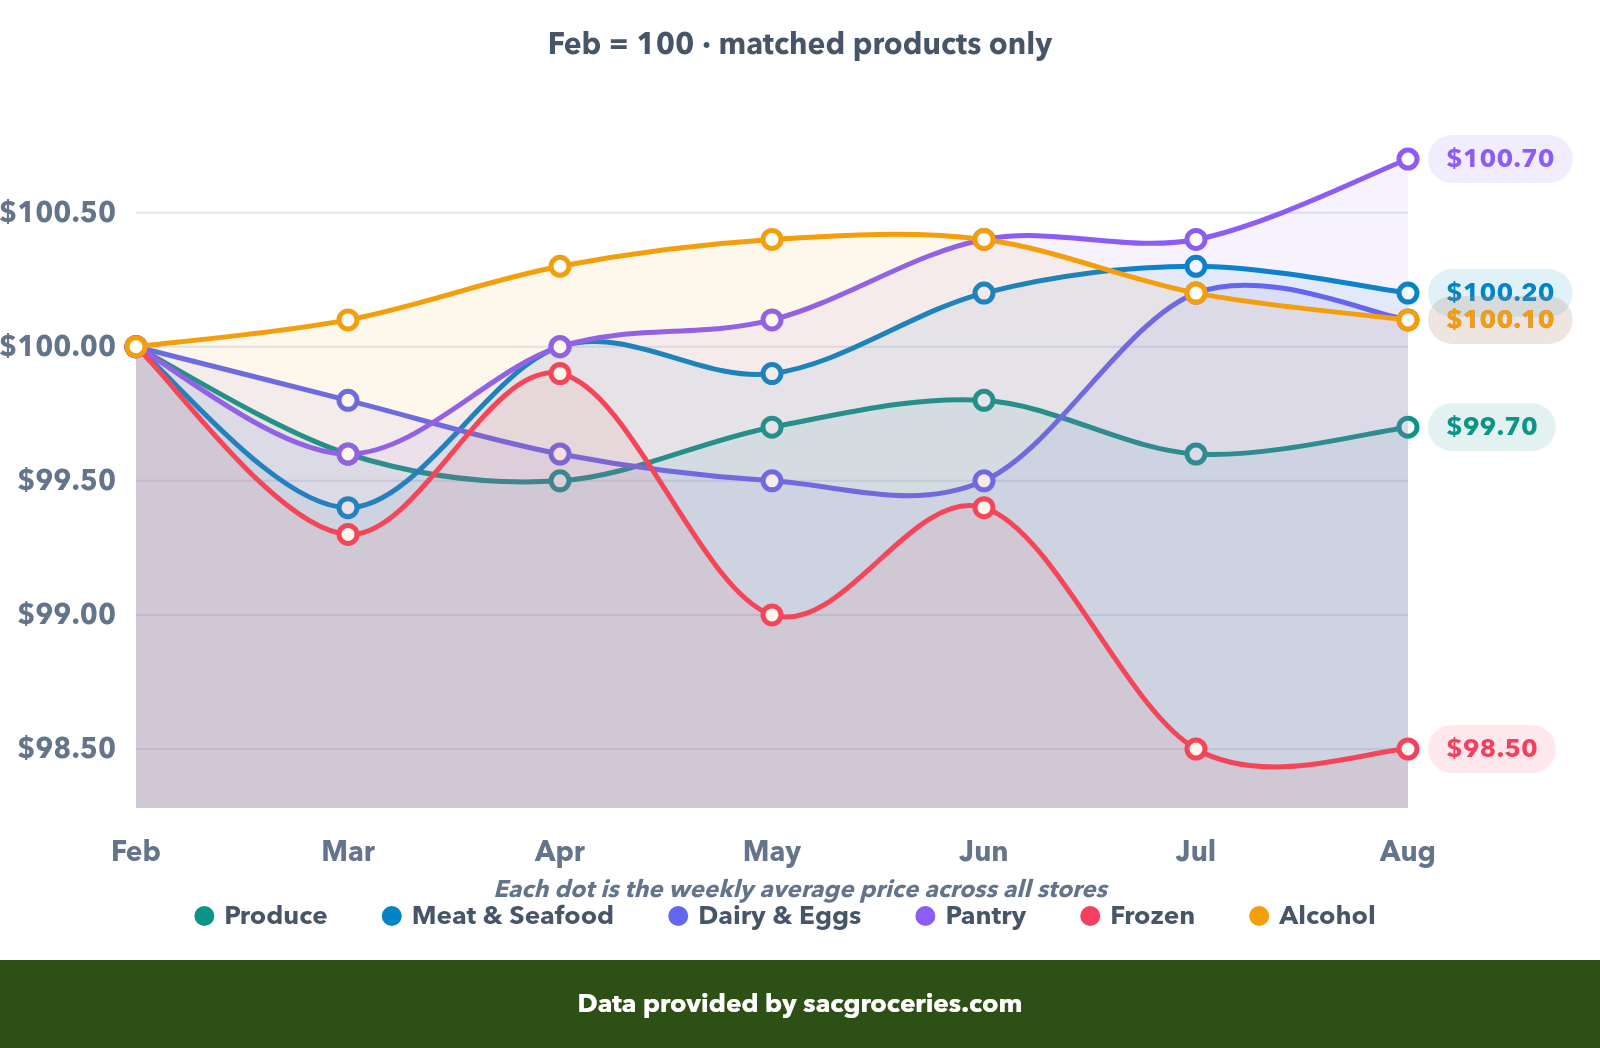
| Category | Feb | Mar | Apr | May | Jun | Jul | Aug |
|---|---|---|---|---|---|---|---|
| Produce | 100.0 | 99.6 | 99.5 | 99.7 | 99.8 | 99.6 | 99.7 |
| Meat & Seafood | 100.0 | 99.4 | 100.0 | 99.9 | 100.2 | 100.3 | 100.2 |
| Dairy & Eggs | 100.0 | 99.8 | 99.6 | 99.5 | 99.5 | 100.2 | 100.1 |
| Pantry | 100.0 | 99.6 | 100.0 | 100.1 | 100.4 | 100.4 | 100.7 |
| Snacks | 100.0 | 99.4 | 99.0 | 98.6 | 98.7 | 98.7 | 99.0 |
| Frozen | 100.0 | 99.3 | 99.9 | 99.0 | 99.4 | 98.5 | 98.5 |
| Bakery | 100.0 | 99.7 | 99.6 | 99.6 | 100.0 | 99.9 | 99.8 |
| Beverages | 100.0 | 100.1 | 99.7 | 99.8 | 99.6 | 99.4 | 100.0 |
| Alcohol | 100.0 | 100.1 | 100.3 | 100.4 | 100.4 | 100.2 | 100.1 |
| Household | 100.0 | 99.8 | 100.9 | 101.3 | 100.9 | 101.4 | 101.4 |
| Health & Beauty | 100.0 | 99.6 | 100.0 | 101.1 | 100.5 | 100.7 | 101.0 |
| Pet | 100.0 | 100.6 | 99.9 | 100.1 | 100.3 | 99.6 | 98.6 |
| Supplements | 100.0 | 102.4 | 102.4 | 102.9 | 103.1 | 103.0 | 102.8 |
Year-to-date change by category
Where each department stands now versus where it started the year, measured on products we priced in every month along the way. 7 categories are up, 5 down. The "typical price" column is the plain average of what we recorded in Aug — useful for a sense of scale, but not comparable across months, because the mix of items behind it shifts.
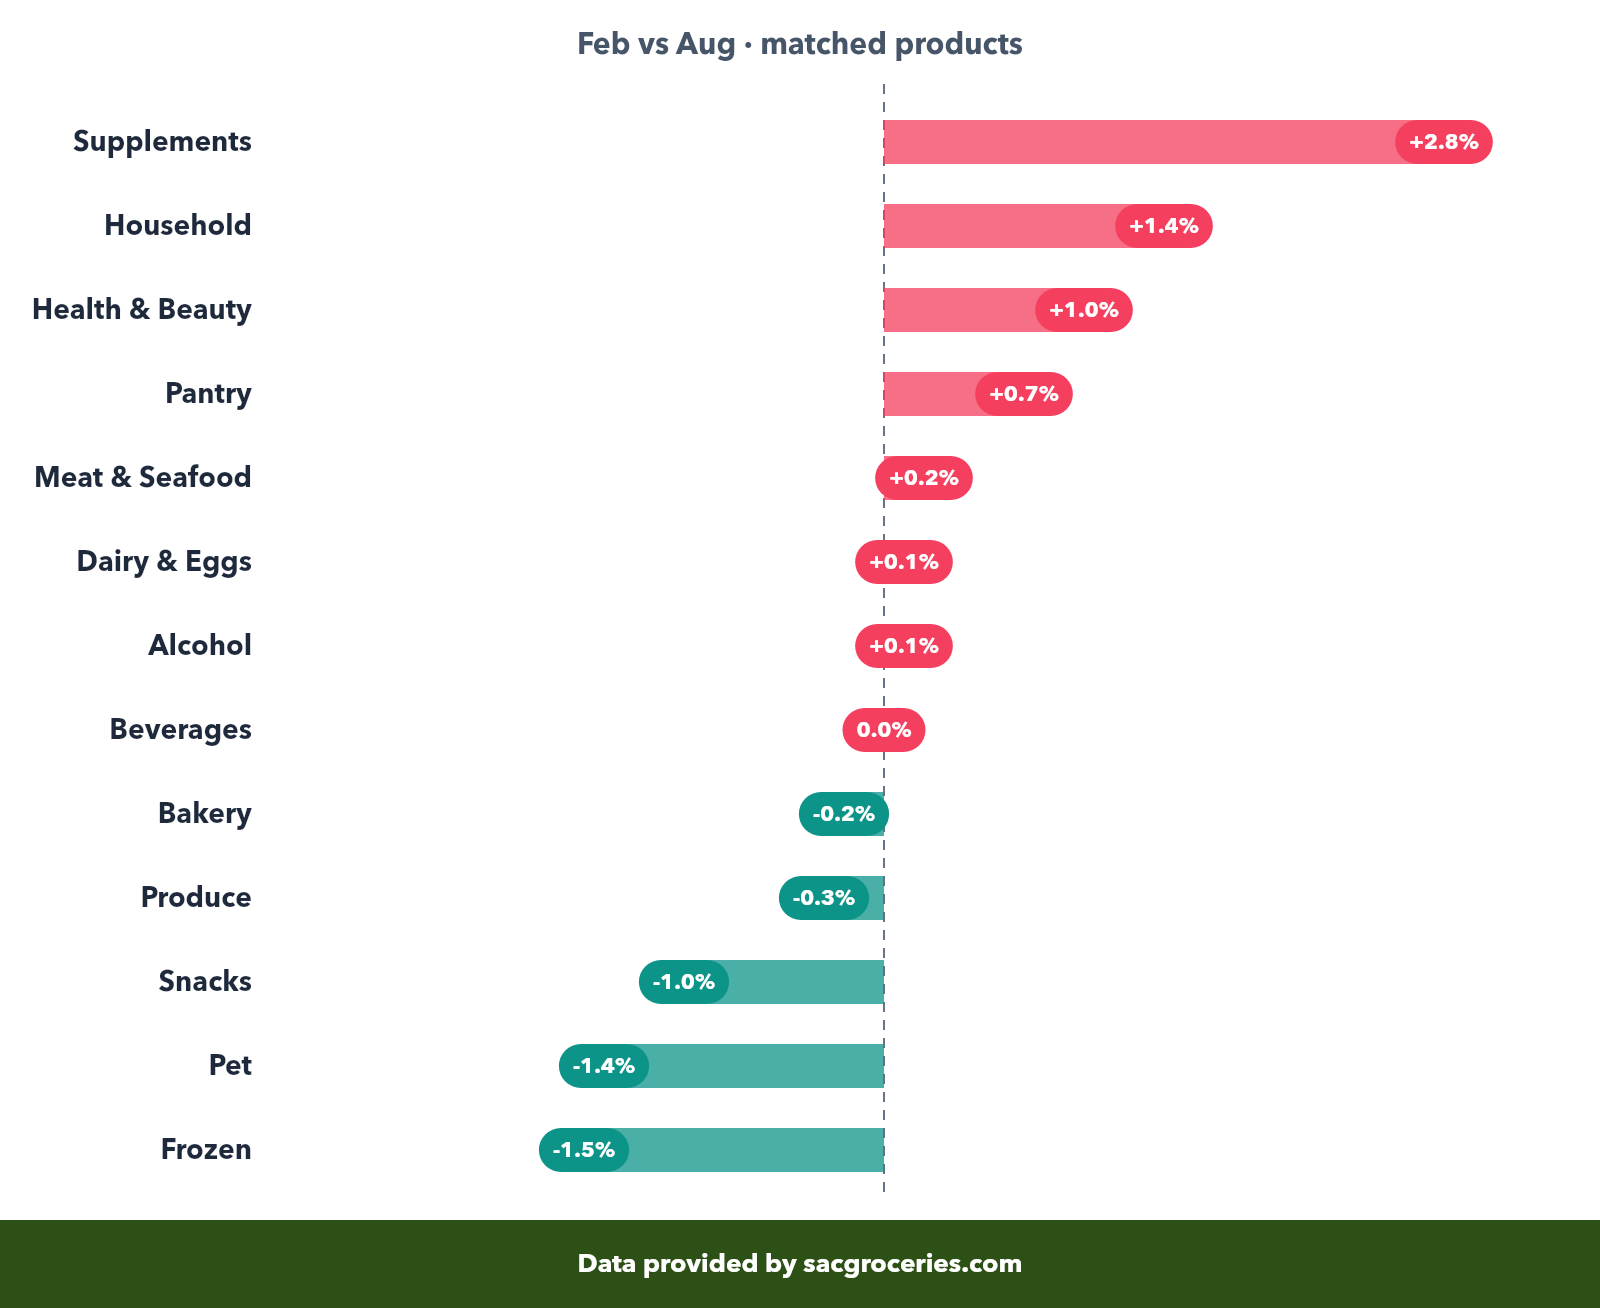
| Category | Feb | Aug | Typical price | Change |
|---|---|---|---|---|
| Supplements | 100.0 | 102.8 | $6.63 | +2.8% |
| Household | 100.0 | 101.4 | $8.70 | +1.4% |
| Health & Beauty | 100.0 | 101.0 | $7.55 | +1.0% |
| Pantry | 100.0 | 100.7 | $6.70 | +0.7% |
| Meat & Seafood | 100.0 | 100.2 | $9.42 | +0.2% |
| Dairy & Eggs | 100.0 | 100.1 | $6.22 | +0.1% |
| Alcohol | 100.0 | 100.1 | $17.15 | +0.1% |
| Beverages | 100.0 | 100.0 | $6.96 | 0.0% |
| Bakery | 100.0 | 99.8 | $6.56 | -0.2% |
| Produce | 100.0 | 99.7 | $5.66 | -0.3% |
| Snacks | 100.0 | 99.0 | $6.59 | -1.0% |
| Pet | 100.0 | 98.6 | $12.90 | -1.4% |
| Frozen | 100.0 | 98.5 | $6.89 | -1.5% |
Were the sales any good?
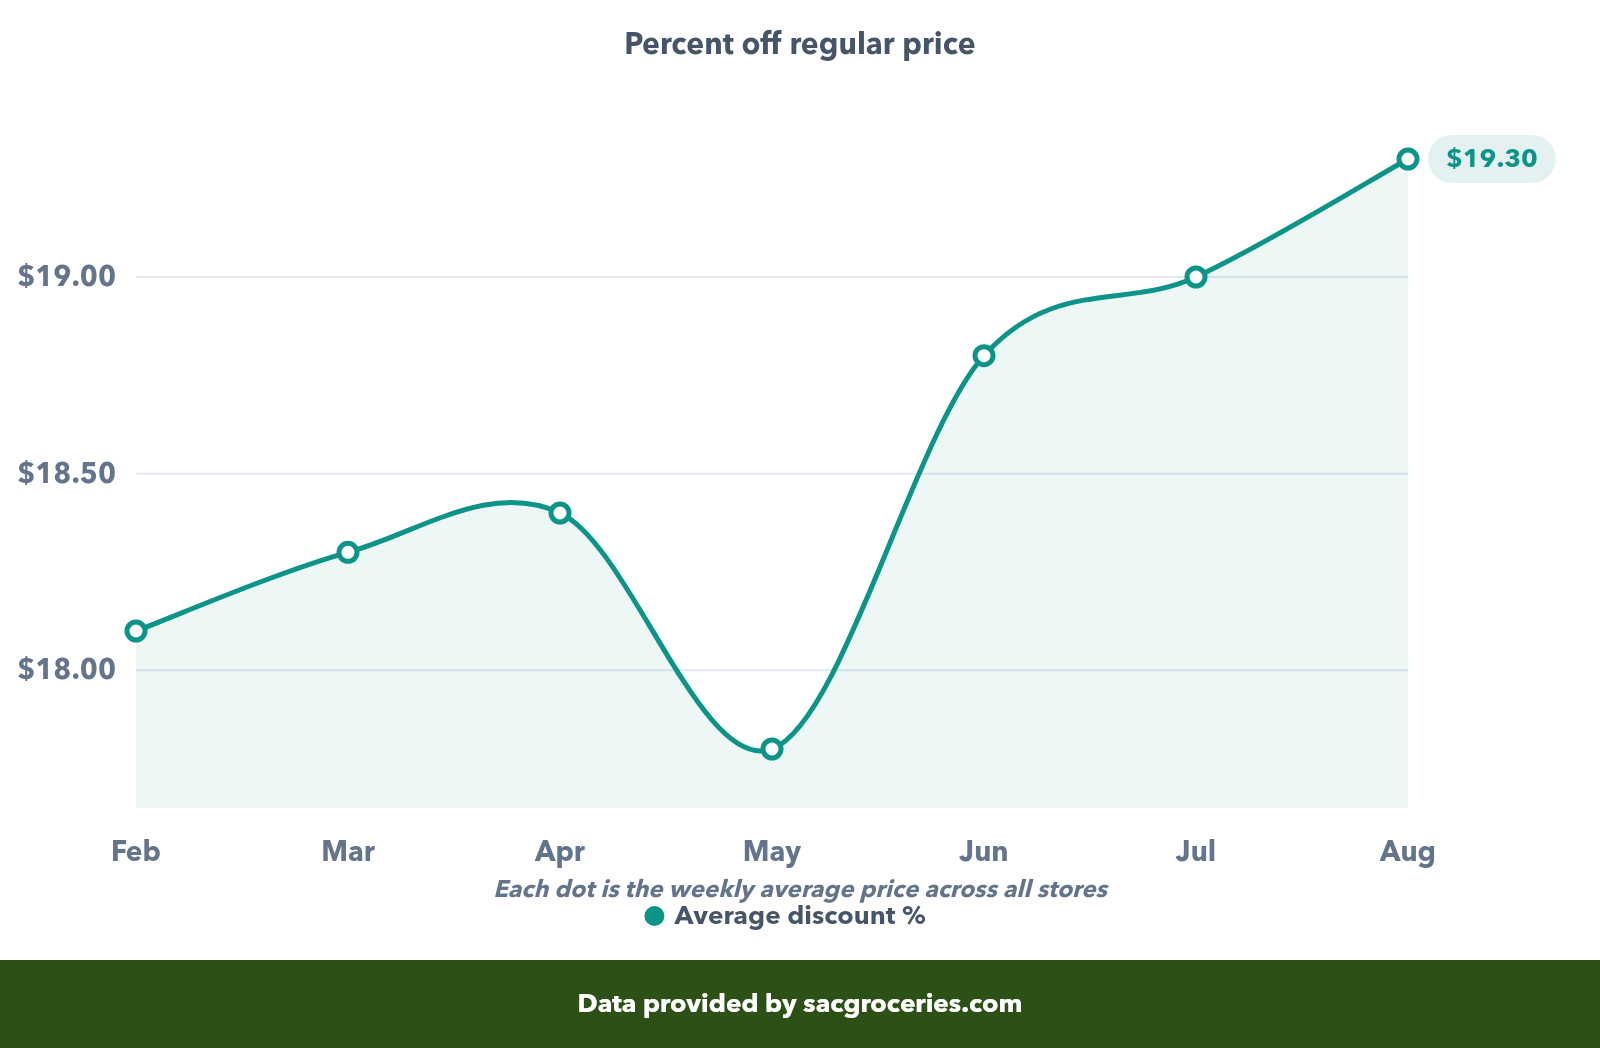
Shelf prices are only half the story. This tracks how deep the average markdown was each month, across every sale item we recorded — useful for knowing whether it was a good month to stock up.
What is behind these numbers
SacGroceries tracks prices through a mix of automated collection from store websites and community contributions. This page is regenerated from the full price history at the start of each month.
- Period covered: Feb through Aug 2026 (7 months)
- Data points: 2,575,370 price records across 189,213 products at 24 stores
- How changes are measured: matched products only. For each pair of consecutive months we keep the items priced in both, take the geometric mean of their price ratios, and chain those links into an index. This is the same matched-model approach official price indices use, and it is why the numbers here are smaller than a naive month-to-month average would suggest — that average mostly measures which items we happened to collect.
- Prices used: the price actually in effect that month — the sale price where an item was on sale, the regular price otherwise.
- Category inclusion: a department appears only if at least 300 of its products can be matched across every consecutive month. Currently excluded: Wine, Spirits, Beer, Baby — we track too few of these across months to measure them honestly.
- Excluded: prices under $0.10 or over $100 as likely errors, months with under 5,000 records, the in-progress month, and per-item swings beyond ±50% in a single month (data errors rather than price moves).
- Coverage changes: the number of stores we collect from moves month to month. Matching products across months absorbs most of that, but not all of it.
| Month | Price records | Products | Stores |
|---|---|---|---|
| Feb 2026 | 60,489 | 59,020 | 19 |
| Mar 2026 | 582,821 | 143,377 | 24 |
| Apr 2026 | 349,380 | 96,571 | 18 |
| May 2026 | 382,574 | 92,952 | 16 |
| Jun 2026 | 378,919 | 96,388 | 16 |
| Jul 2026 | 440,712 | 96,178 | 20 |
| Aug 2026 | 380,475 | 89,353 | 19 |
Want today's prices, not this year's averages?
Compare current prices across every Sacramento store we track, or build a shopping list that finds the cheapest option for each item.