Sacramento Grocery Prices: What Moved in May 2026
Every week, we collect prices from 16 grocery stores across Sacramento. May 2026 was the quietest month in our records: measured on the same products, no department moved more than six tenths of a percent in either direction.
Overall price trends
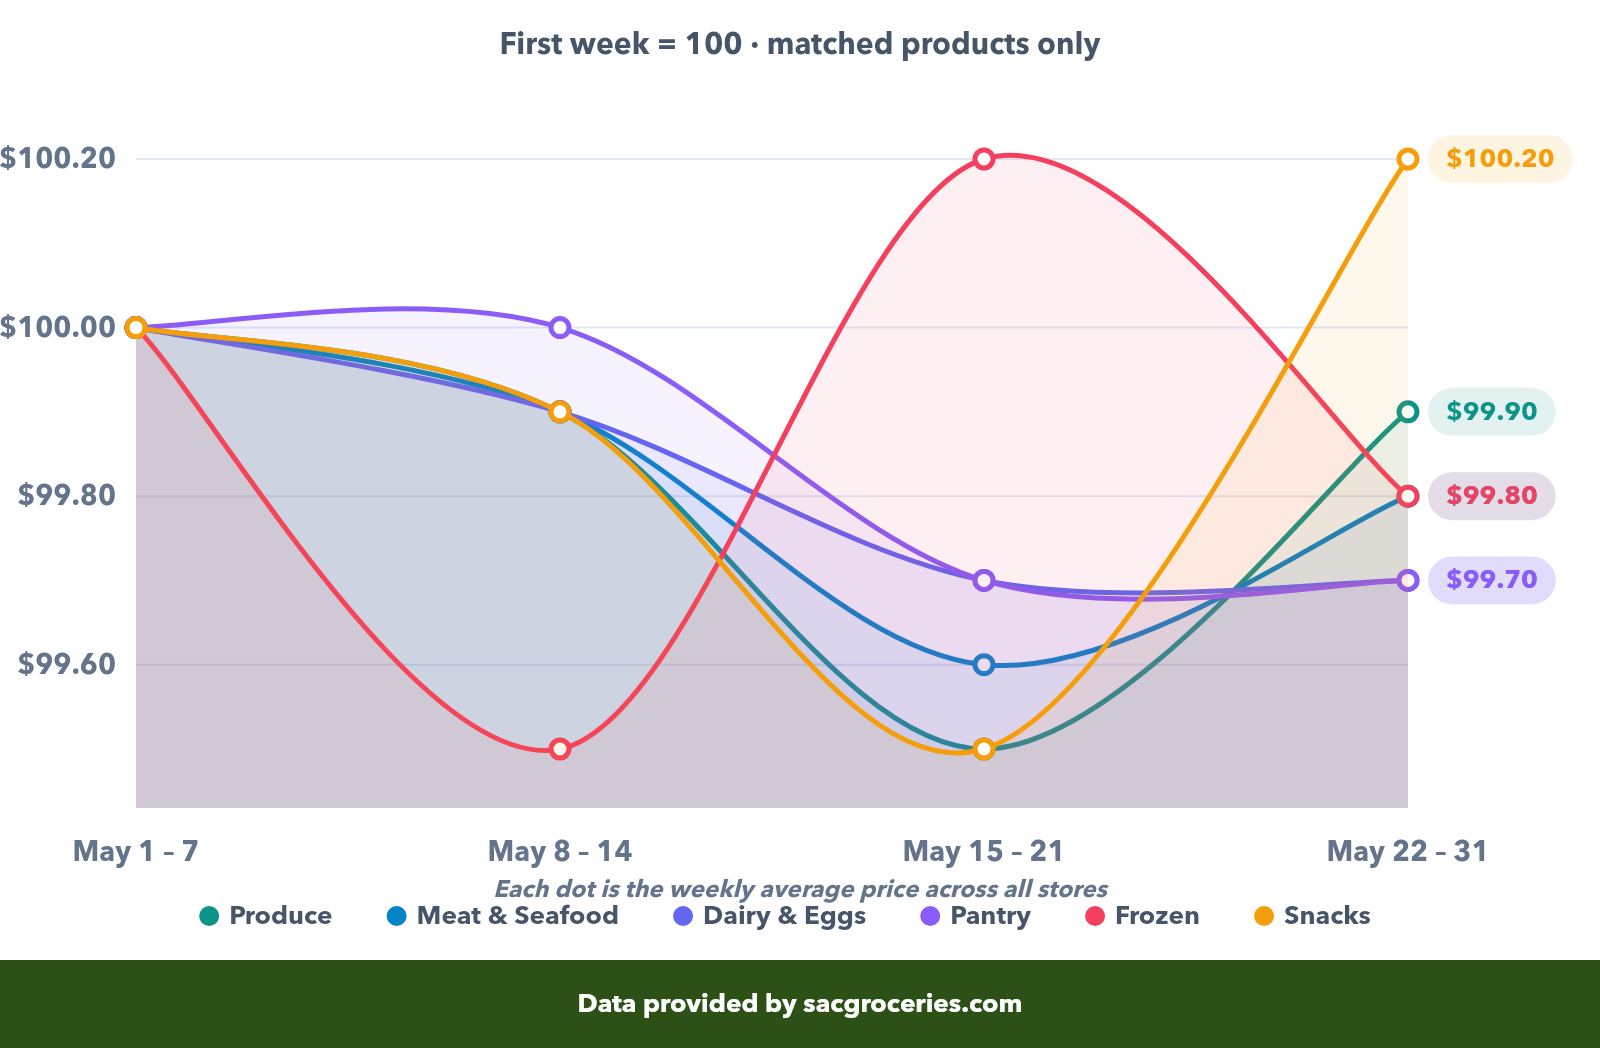
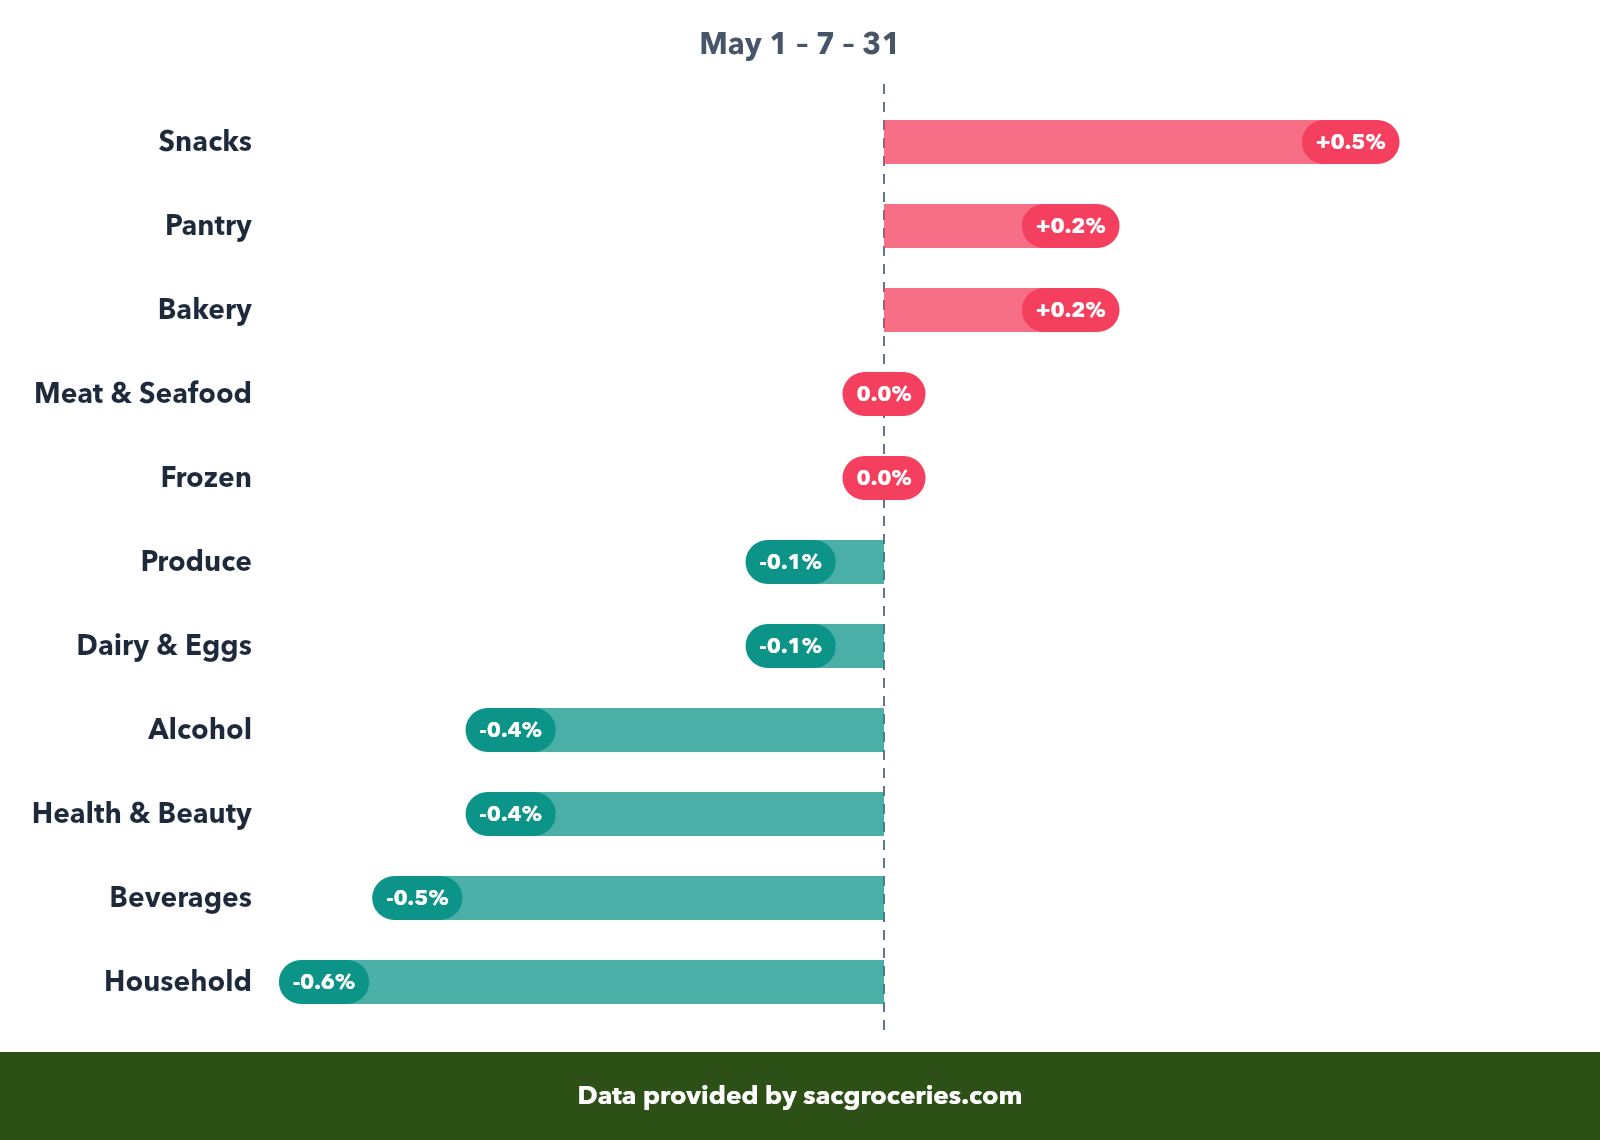
May did almost nothing. On matched products the entire store finished inside a 1.1-point band, from snacks at +0.5% to household at −0.6%. Meat and frozen landed exactly flat. The one number that did stand out was sale depth: at 17.1% off regular price, May had the shallowest average discount of the year, so there was less reason than usual to time a stock-up.
Category Price Index: Week-over-Week (first week = 100)
Category breakdown
This is what a genuinely flat month looks like — eleven departments, none moving more than 0.6%. These figures compare only products we priced in both the first and last week of the month, so a change in which items we collected cannot show up here as a price change — which is why they are far smaller than a raw average of each department would suggest.
Price Change by Category (May 1 – 7 – May 22 – 31)
| Category | Typical price May 1 – 7 | Typical price May 22 – 31 | Change (matched) |
|---|---|---|---|
| Snacks | $7.84 | $7.09 | +0.5% |
| Pantry | $7.96 | $7.74 | +0.2% |
| Bakery | $7.55 | $7.45 | +0.2% |
| Meat & Seafood | $9.36 | $8.44 | 0.0% |
| Frozen | $6.85 | $6.43 | 0.0% |
| Produce | $6.30 | $6.06 | -0.1% |
| Dairy & Eggs | $6.59 | $6.16 | -0.1% |
| Alcohol | $18.65 | $18.49 | -0.4% |
| Health & Beauty | $7.64 | $7.59 | -0.4% |
| Beverages | $7.07 | $6.83 | -0.5% |
| Household | $9.81 | $8.54 | -0.6% |
The two price columns are plain averages of everything we recorded in those weeks — useful for a sense of scale, but the mix of items behind them shifts, so they will not divide out to the change column. The change is measured only on products we priced in both weeks.
Produce spotlight
Produce finished May down 0.1% — effectively unchanged, which is rare for the department.
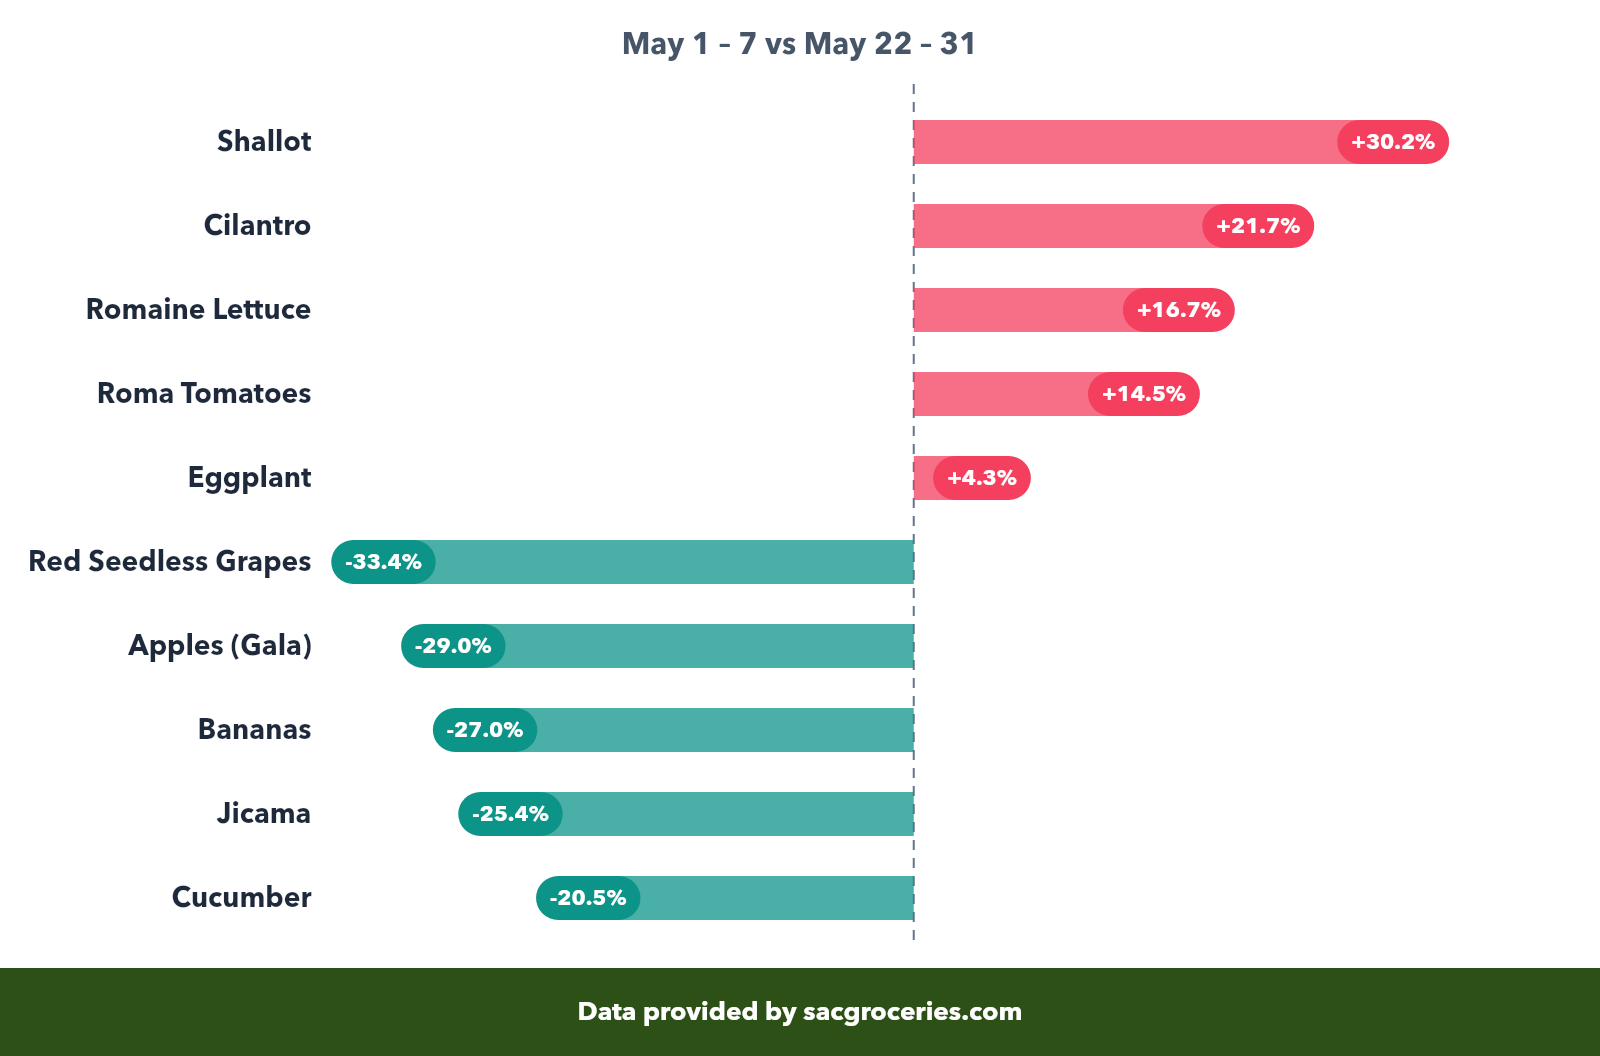
Products with the biggest price swings across multiple stores. Items available at fewer than 3 stores are excluded.
Meat & Seafood spotlight
Meat ended the month exactly flat despite an aggressive Memorial Day ad calendar.
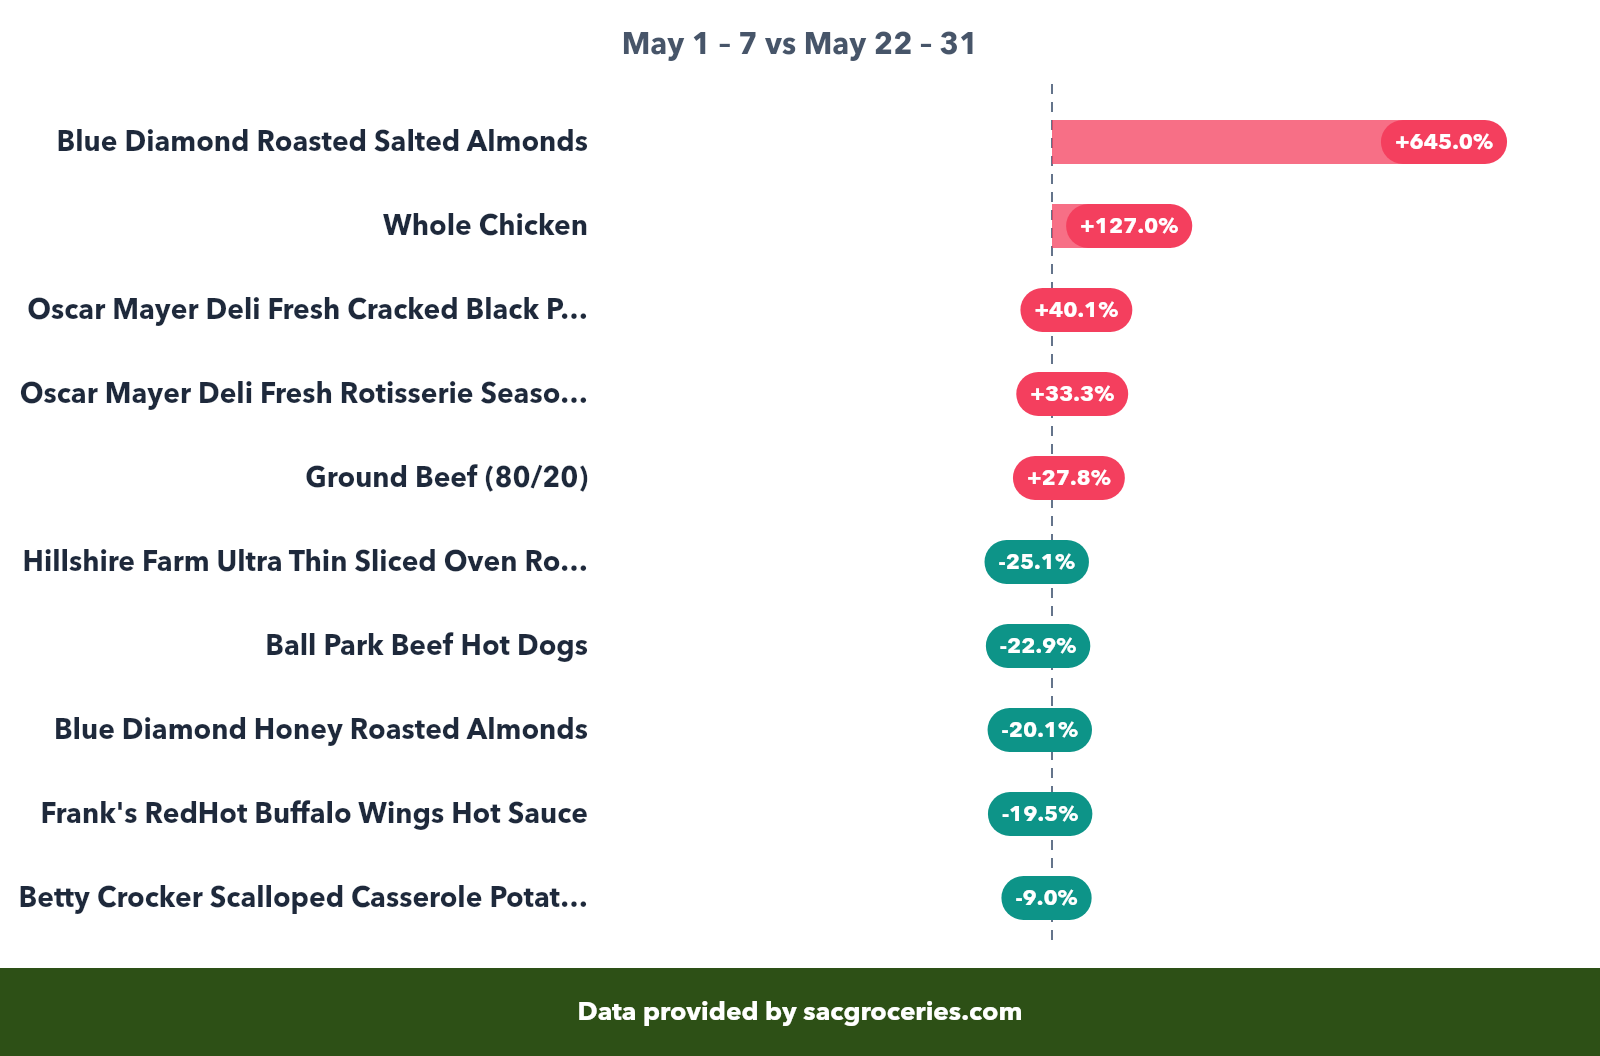
Products with the biggest price swings across multiple stores. Items available at fewer than 3 stores are excluded.
Dairy & Eggs spotlight
Dairy and eggs slipped 0.1%, about as still as a category gets.
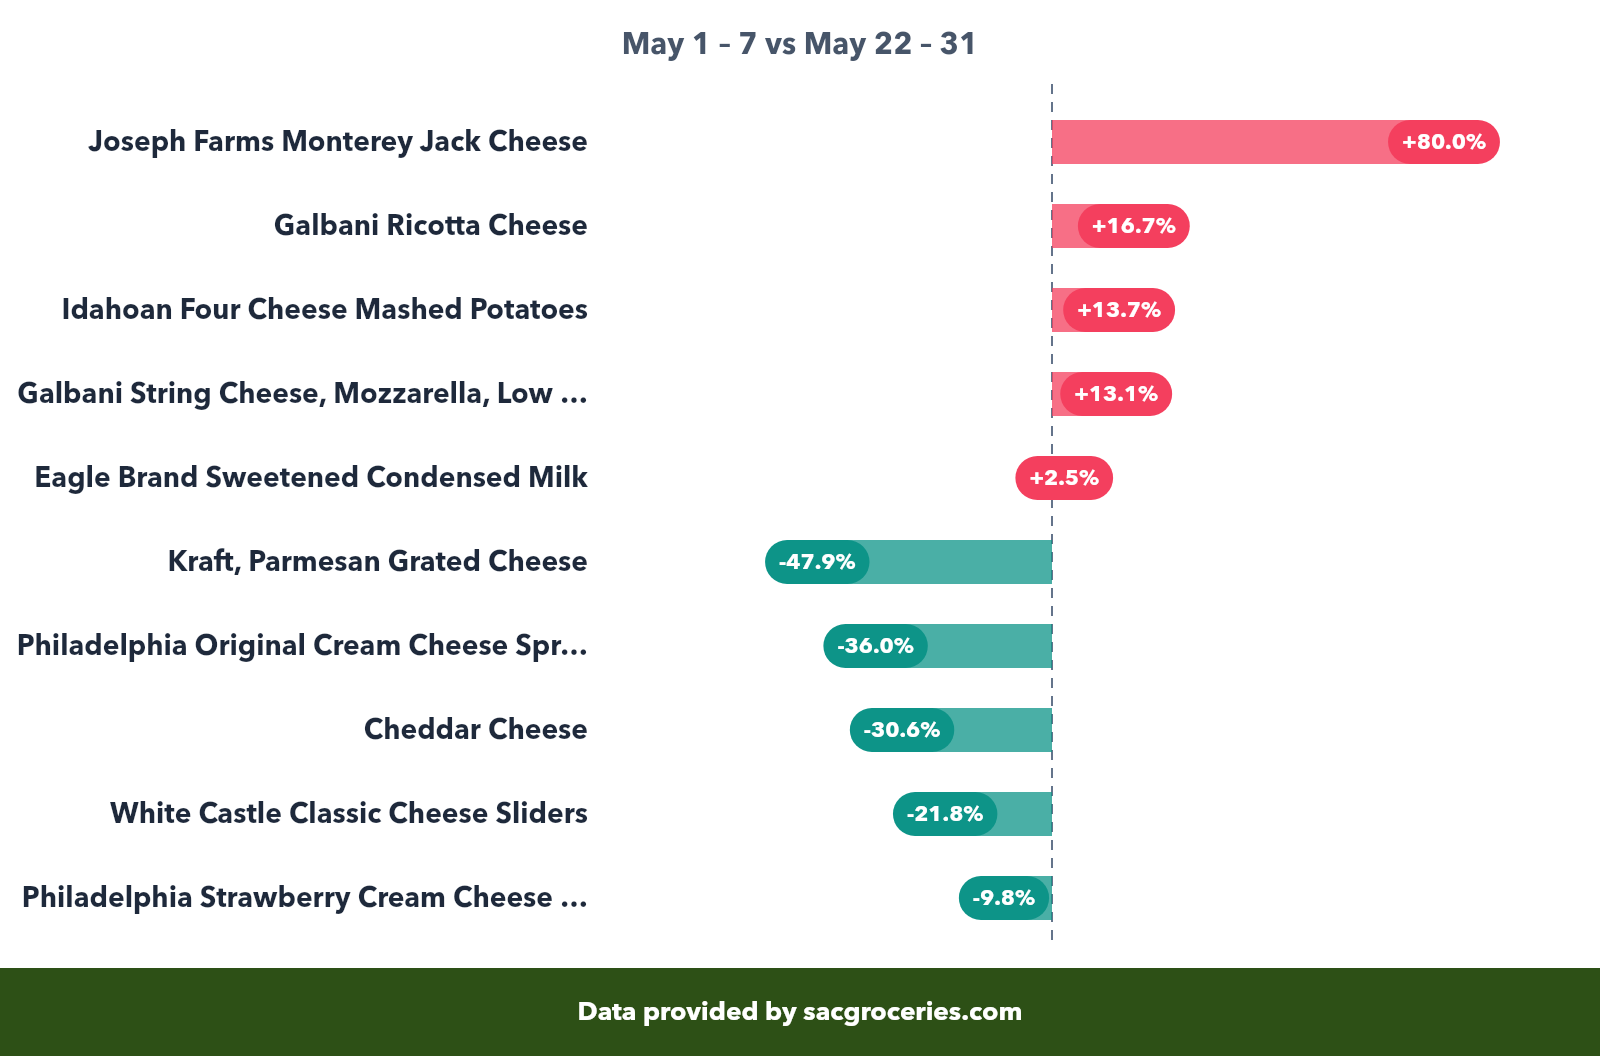
Products with the biggest price swings across multiple stores. Items available at fewer than 3 stores are excluded.
Pantry spotlight
Pantry edged up 0.2% across roughly 10,500 matched products.
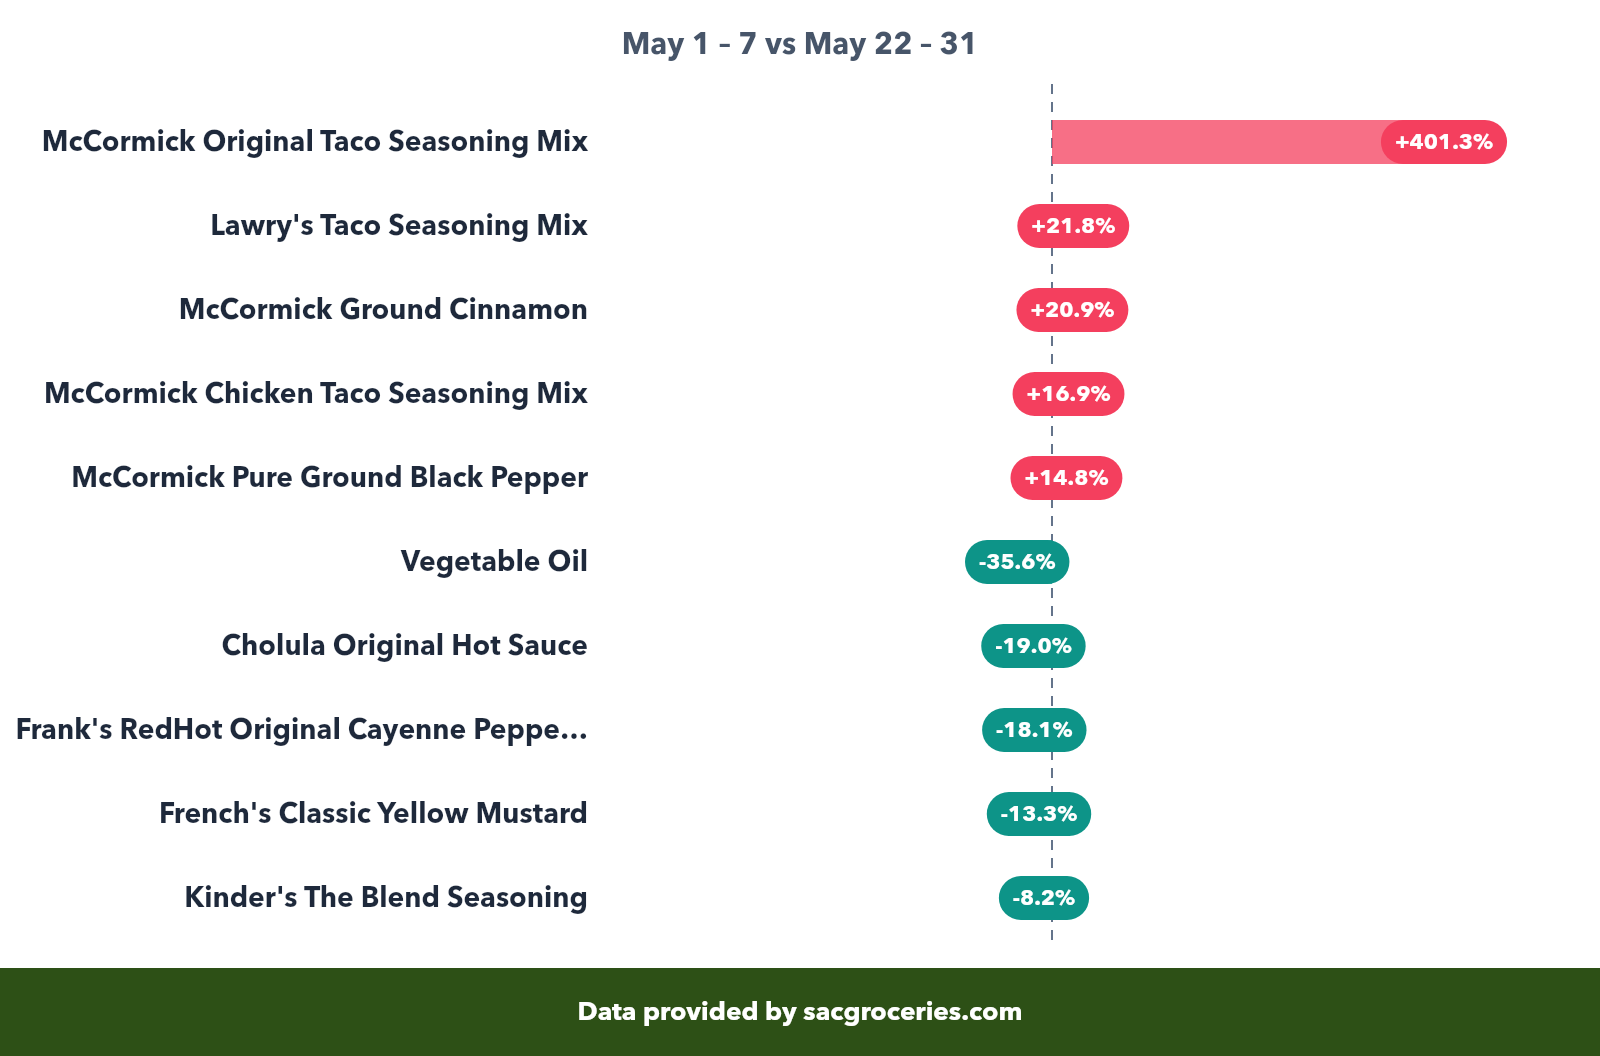
Products with the biggest price swings across multiple stores. Items available at fewer than 3 stores are excluded.
Frozen spotlight
Frozen finished flat, sitting out a month in which almost nothing moved.
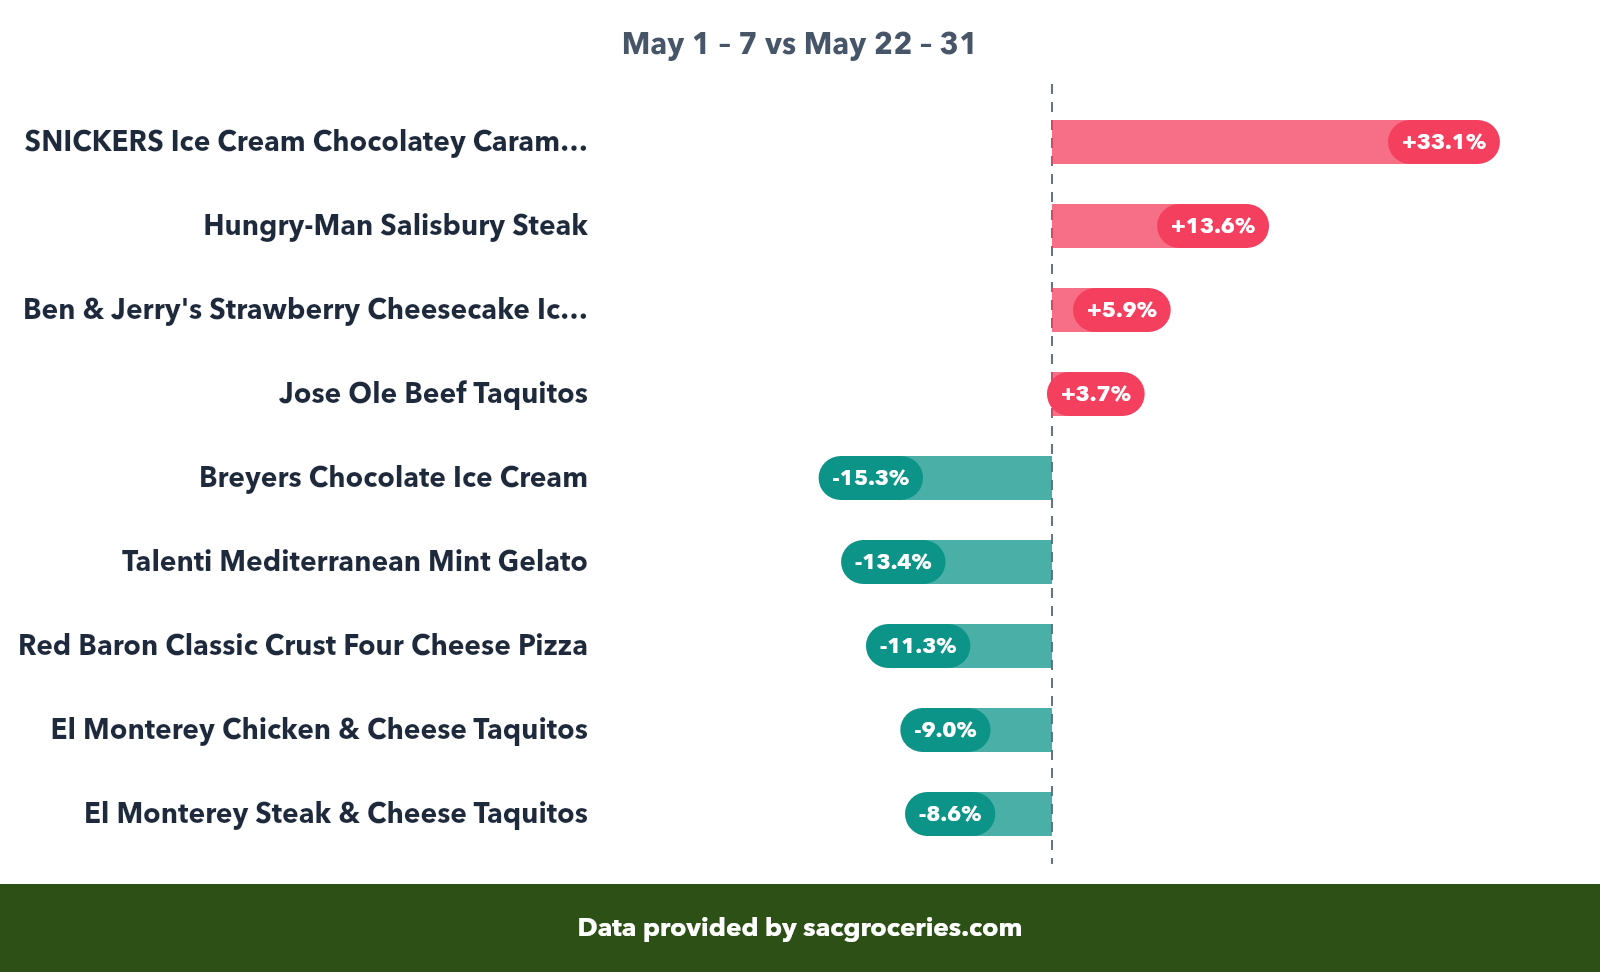
Products with the biggest price swings across multiple stores. Items available at fewer than 3 stores are excluded.
Snacks spotlight
Snacks led the month at +0.5%, which tells you how quiet May was.
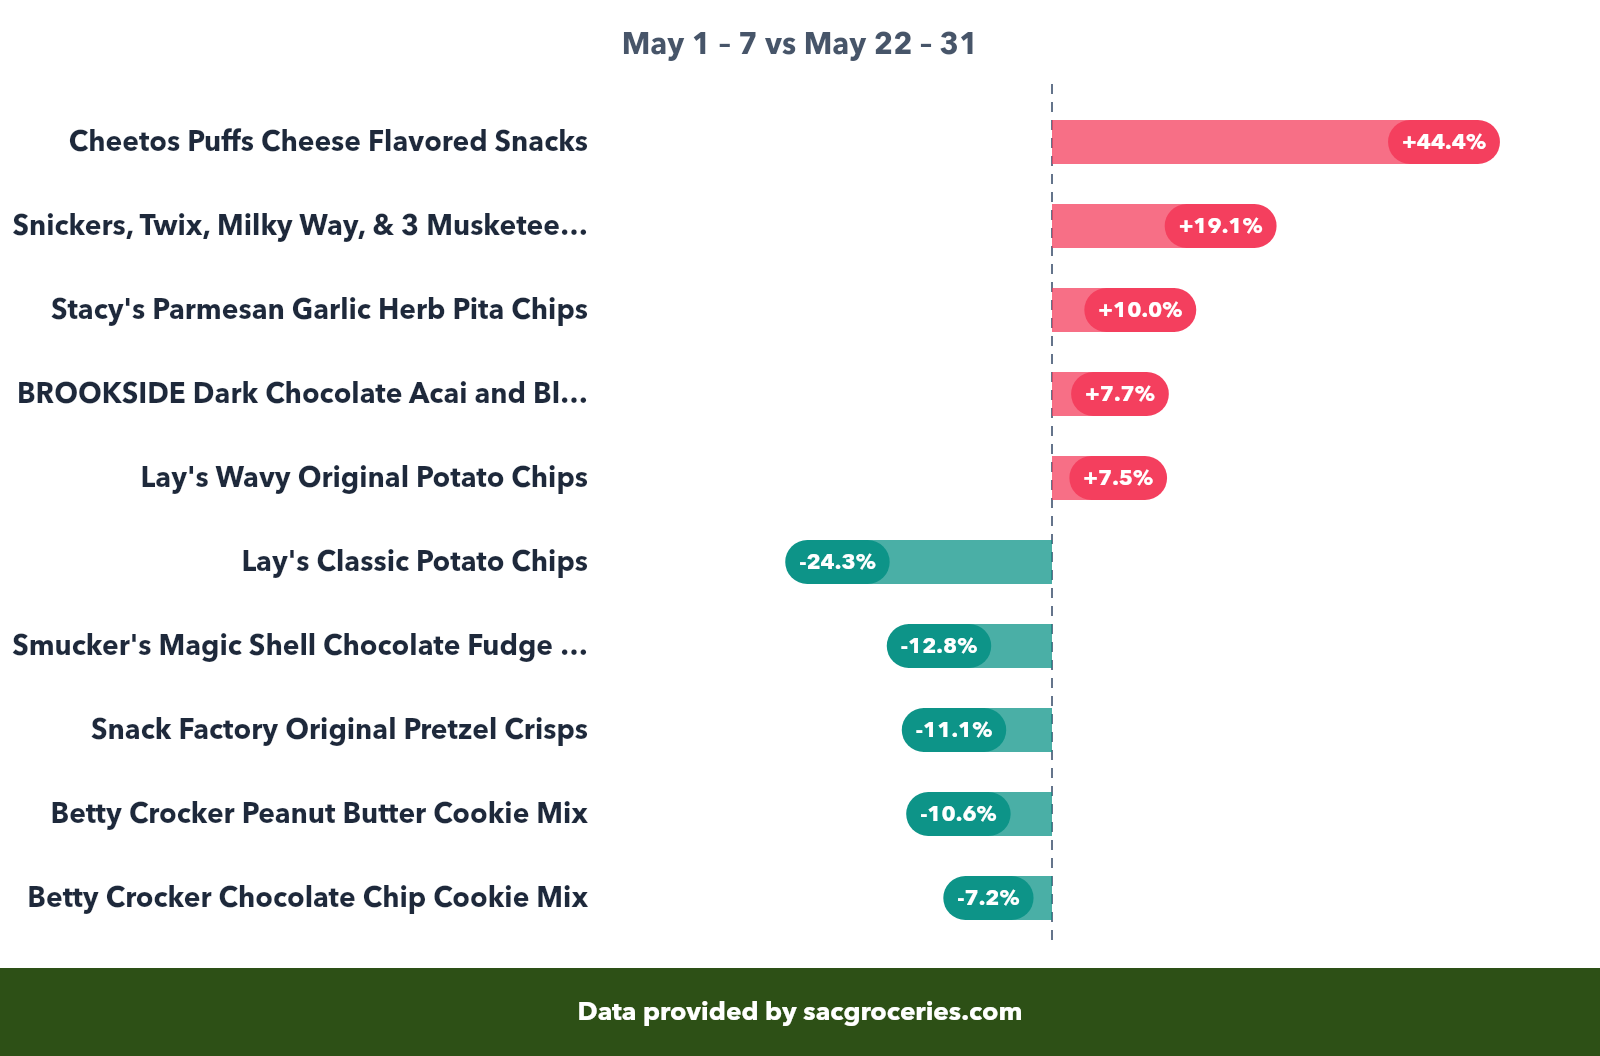
Products with the biggest price swings across multiple stores. Items available at fewer than 3 stores are excluded.
Bakery spotlight
Bakery added 0.2%, holding its steady pattern.
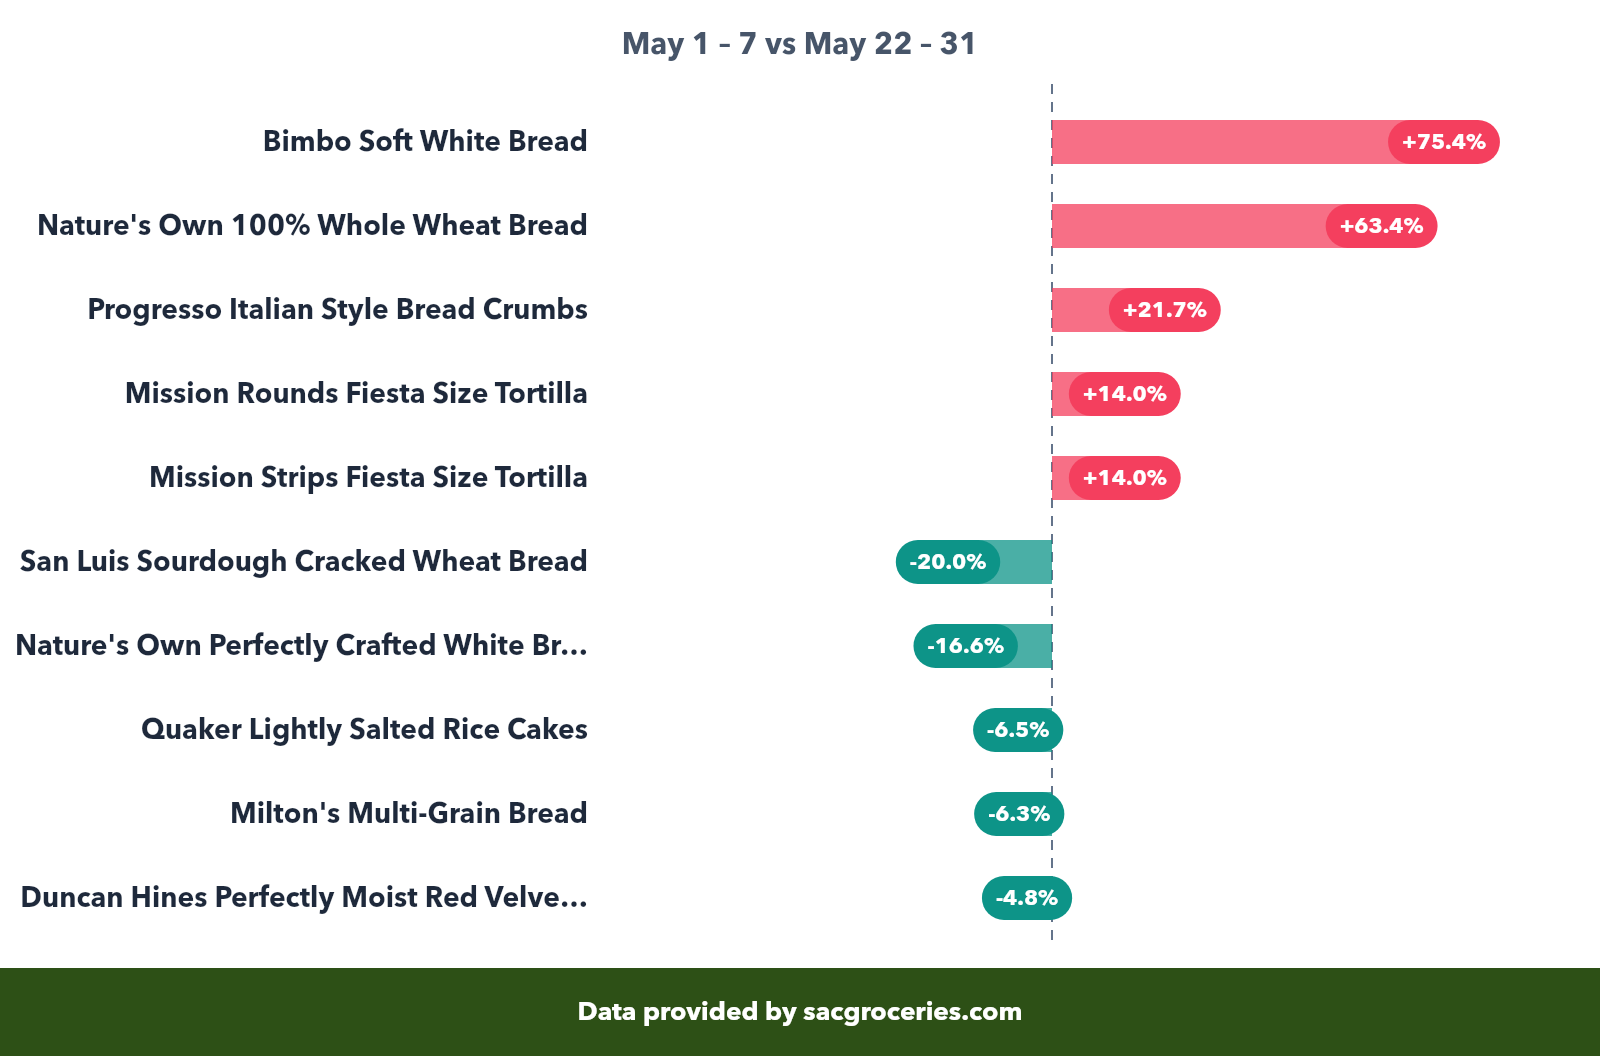
Products with the biggest price swings across multiple stores. Items available at fewer than 3 stores are excluded.
Beverages spotlight
Beverages eased 0.5%, the second-largest decline in a month with no large declines.
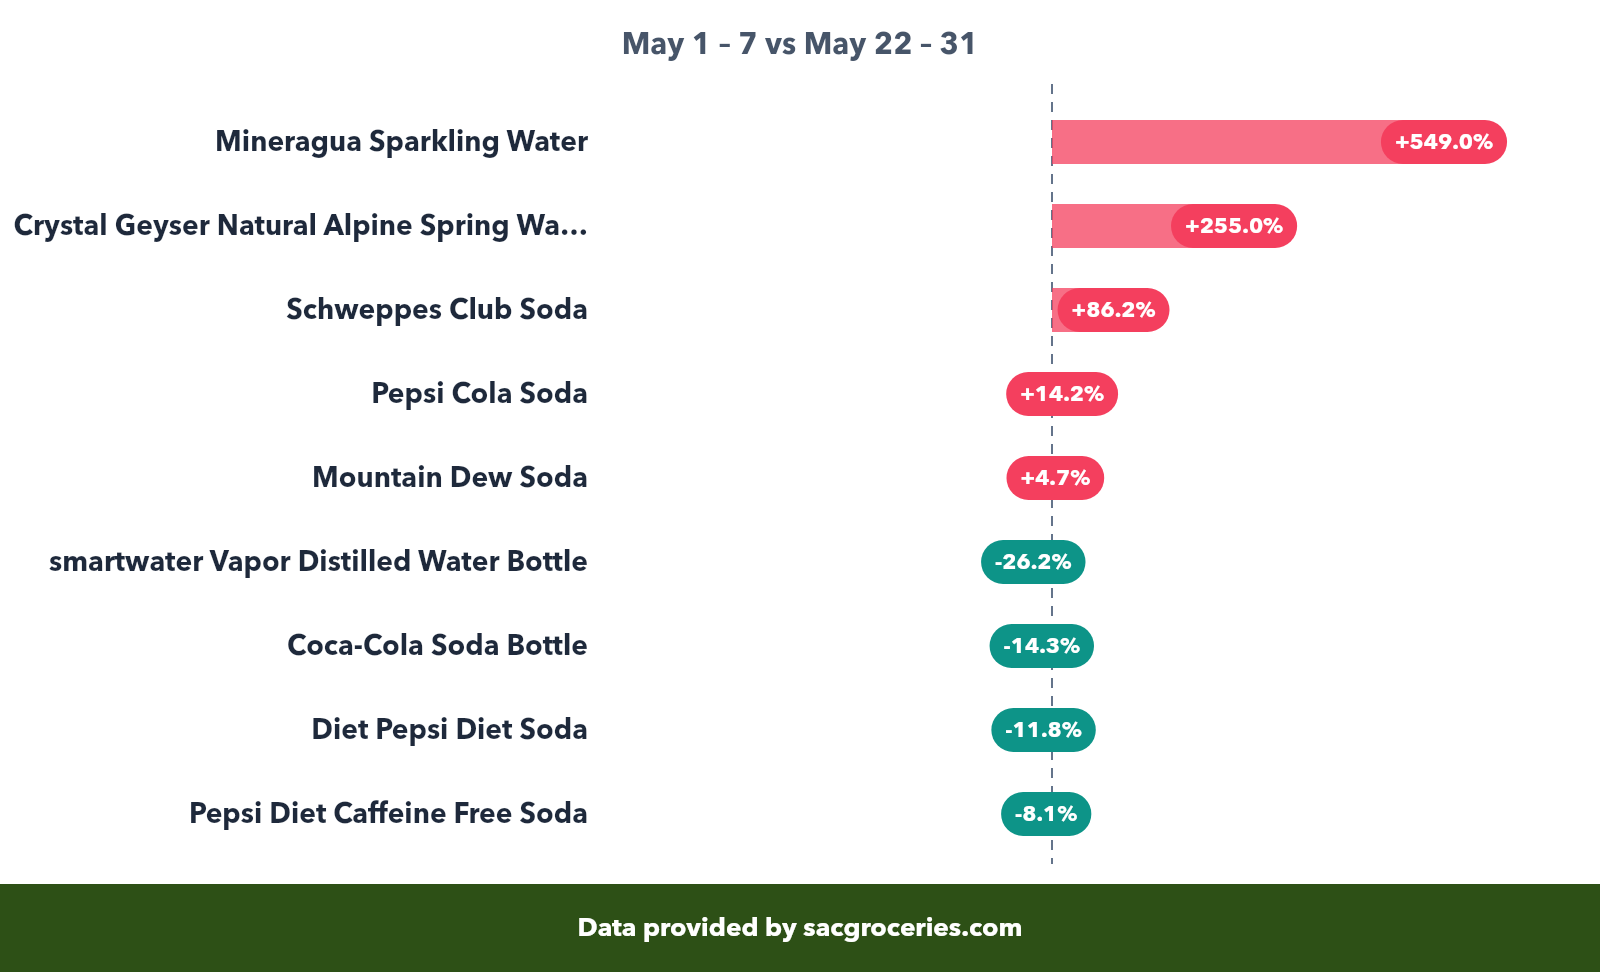
Products with the biggest price swings across multiple stores. Items available at fewer than 3 stores are excluded.
Biggest movers
These products saw the biggest real price changes across multiple stores, after filtering out one-off promotions and data quirks.
Produce
Meat & Seafood
Dairy & Eggs
Pantry
Frozen
Bakery
Sale trends
Weekly sales are a big part of the grocery price picture. The average sale discount was 17.1% off regular price. Here's how sale volume shifted week to week.
| Store | Products | % on Sale | Avg Price |
|---|---|---|---|
| Raley's / Bel Air / Nob Hill | 253 | 44.3% | $8.79 |
| Sprouts | 6,765 | 33.3% | $7.96 |
| FoodMaxx | 13,879 | 25.7% | $6.81 |
| Foods Co. | 2,797 | 24.3% | $3.65 |
| Food 4 Less | 2,764 | 23.5% | $3.77 |
| Sacramento Natural Foods Co-op | 9,260 | 15.1% | $8.60 |
| Whole Foods | 4,228 | 14.0% | $9.52 |
| Target | 14,044 | 7.6% | $11.02 |
| Rancho San Miguel | 8,494 | 0.9% | $5.17 |
| Trader Joe's | 2,977 | 0.0% | $5.07 |
| 99 Ranch Market | 2,308 | 0.0% | $5.71 |
How we collected this data
SacGroceries tracks prices through a combination of automated collection from store websites and community contributions. Prices are collected weekly for most stores, with some high-volume stores updated more frequently.
- Period covered: 2026-05-01 – 2026-05-31 (May 2026)
- Stores tracked: 16 Sacramento-area grocery stores
- Data points: 382,574 price records across 92,952 products
- Filtering: Prices below $0.10 or above $100 are excluded as likely data errors. Items must appear at 2+ stores for cross-store comparisons. Price swings over 500% between weeks are excluded. Stores where we only collect sale flyer data (over 80% of prices are sale prices) are excluded from the sale trends table since their data would be misleading.
- Averages: All averages use the effective price (sale price when available, regular price otherwise).
These numbers are a snapshot. Actual prices vary by location and date. With 93K+ products, some data errors slip through despite our filtering.
Want to find the best prices right now?
Compare prices across all 16 Sacramento stores, or build a shopping list that finds the cheapest option for every item.